All Videos Must Be Watched In Internet Explore
Culminating Task
Please keep your work neat and presentable!
Rational:
At the end of each unit students will be responsible for completing a culminating task that provides evidence they have internalized the concepts and content of the given unit.
Strand 1: Culminating Task:
Students will tackle their science fair project and complete their culminating task for stand 1 at the same time. Use strand 1 concepts 1-4 and create a science fair project that addresses each concept and its individual PO's.
Concept 1: Observations, Questions, and Hypotheses
Formulate predictions, questions, or hypotheses based on observations. Locate appropriate resources
PO1. Differentiate among a question, hypothesis, and prediction.
PO 2. Formulate questions based on observations that lead to the development of a hypothesis.
PO 3. Locate research information, not limited to a single source, for use in the design of a controlled investigation.
How To Join Quizlet
Scientific Method Intro
Penny Drop Experiment
Safety Test Prep Video
Metric System Video
Skittles Lab
Please take notes on the videos that are labeled SOURCE in order to create a strong hypothesis concerned with identifying which color Skittles has the highest frequency per package.
Concept 2: Scientific Testing (Investigating and Modeling) Design and conduct controlled investigations.
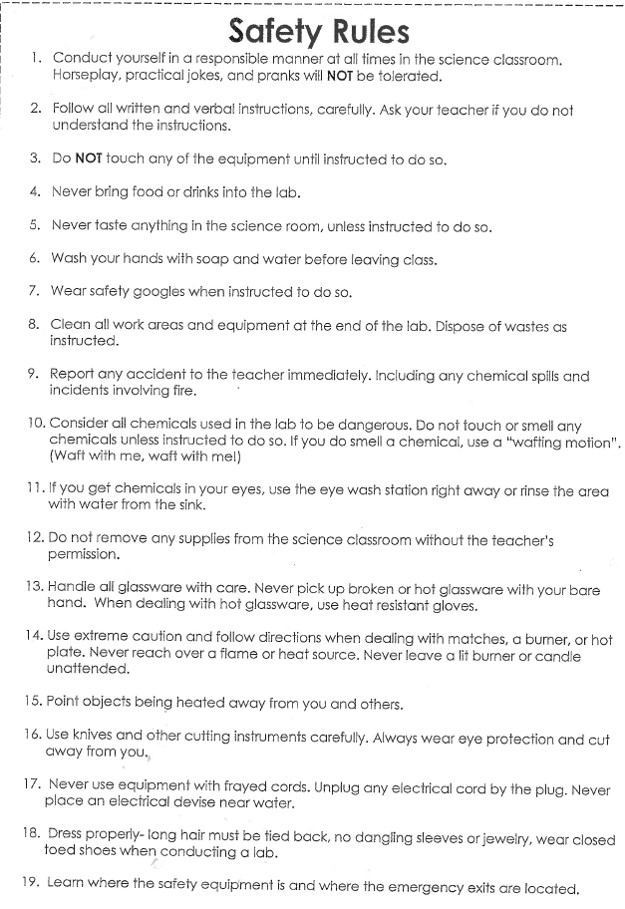
PO 1. Demonstrate safe behavior and appropriate procedures (e.g., use and care of technology, materials, organisms) in all science inquiry.
PO 2. Design an investigation to test individual variables using scientific processes.
PO 3. Conduct a controlled investigation using scientific processes.
PO 4. Perform measurements using appropriate scientific tools (e.g., balances, microscopes, probes, micrometers).
PO 5. Keep a record of observations, notes, sketches, questions, and ideas using tools such as written and/or computer logs.
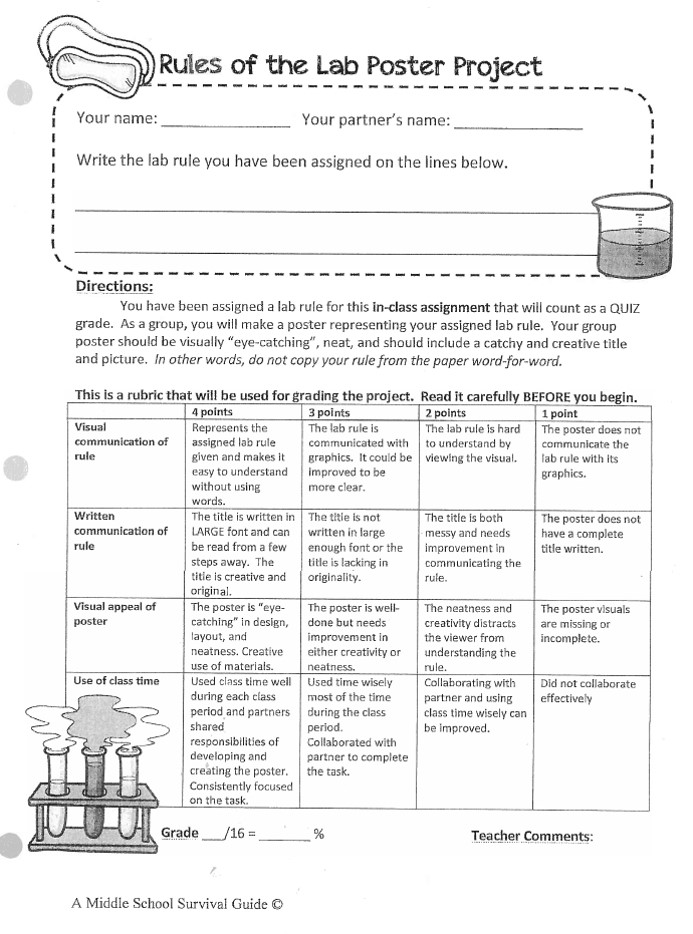
Lab Safety Poster
Variables in Science
Lab Equipment Intro
Lab Equipment Stations
Microscope Intro
Lab Equipment Test Prep Video
Concept 3: Analysis and Conclusions Analyze and interpret data to explain correlations and results; formulate new questions.
PO 1. Analyze data obtained in a scientific investigation to identify trends.
PO 2. Form a logical argument about a correlation between variables or sequence of events (e.g., construct a cause-and-effect chain that explains a sequence of events).
PO 3. Evaluate the observations and data reported by others.
PO 4. Interpret simple tables and graphs produced by others
PO 5. Analyze the results from previous and/or similar investigations to verify the results of the current investigation.
PO 6. Formulate new questions based on the results of a completed investigation.
How To Find The Percentage of Skittles In a Packages Given Its Frequency
This is important to understand in order to find percentages. Watch and work with me through each problem.
Concept 4: Communication Communicate results of investigations.
PO 1. Choose an appropriate graphic representation for collected data: • line graph • double bar graph • stem and leaf plot • histogram
PO 2. Display data collected from a controlled investigation.
PO 3. Communicate the results of an investigation with appropriate use of qualitative and quantitative information.
PO 4. Create a list of instructions that others can follow in carrying out a procedure (without the use of personal pronouns)
PO 5. Communicate the results and conclusion of the investigation.
